What is a Cloud Contact Center? A Complete Guide
Prashanth Kancherla
Jun 16, 2025 | 14 mins read

How Does a Cloud Contact Center Work?
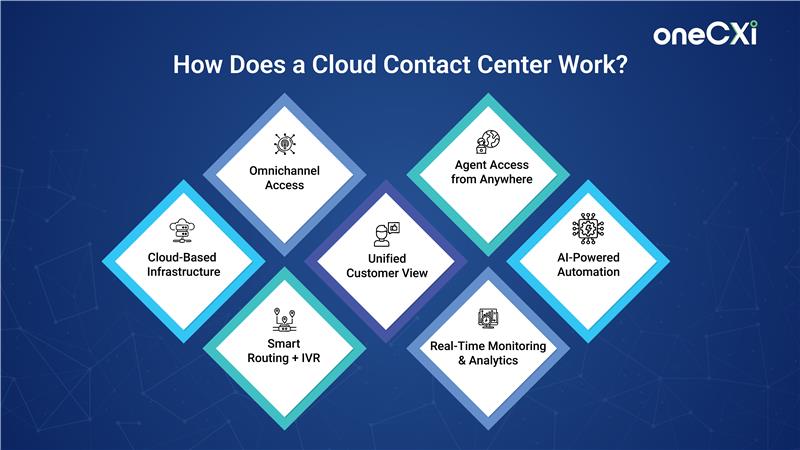
A cloud contact center runs on remote servers managed by your software provider. You access the entire system through a secure internet connection—no on-site hardware or phone systems needed.
Here’s how it typically works:
- Infrastructure and Access: Your provider hosts everything in the cloud. You just need internet-connected devices (computers, headsets, phones). Agents log into the software from anywhere and start taking calls or messages immediately.
- Call and Message Routing: The software automatically routes each customer interaction to the right agent based on rules you set. For example, if someone calls for technical support, the system can skip sales agents and connect them directly to the support team.
- IVR for Self-Service: IVR software helps customers get quick answers through a menu without waiting for an agent. For instance, a caller can press “1” to check their account balance or “2” to speak to billing, before even talking to a human.
- CRM and Context Sync: The system links to your CRM so agents can see a customer’s history, recent purchases, or past issues as soon as they pick up the call. This saves time and helps deliver faster, more personalized support.
- Multi-Channel Conversations: The platform keeps voice, email, chat, and social media conversations in one place. This means if a customer first sends a message on Instagram and later calls your support line, the agent will have full context.
- Monitoring and Analytics: Supervisors can monitor live calls, track performance, and review customer sentiment. You get detailed reports on things like call wait times, agent productivity, and common issues. This helps you identify where things are working and where they aren’t.
- Scalability and Flexibility: Because the system runs in the cloud, you can quickly adjust capacity. Need to add 20 agents during the holidays? You can do that without upgrading any hardware. Want to launch a new support channel like WhatsApp? Most cloud platforms make this easy to switch on.
How to Migrate from On-Premise to Cloud Contact Center
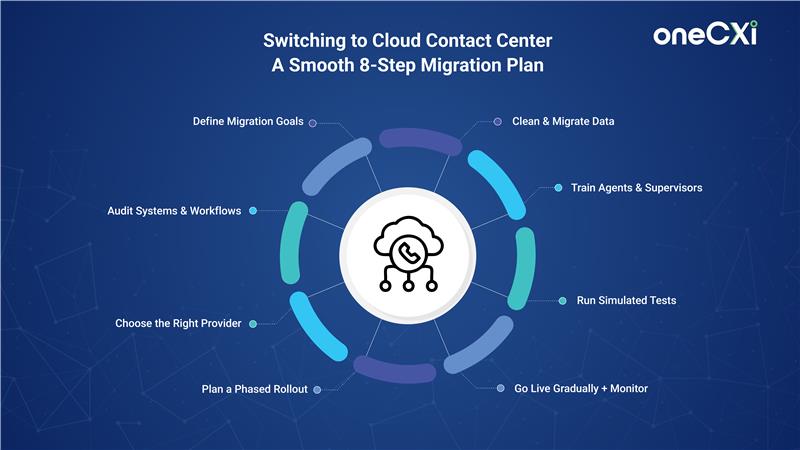
Here’s a detailed, step-by-step guide to help you migrate your contact center without losing operational control or customer satisfaction.
1. Understand Your Goals Clearly
Start by defining why you want to move to the cloud. The reasons should go beyond vague ideas like “improve service.” Think specifically about what problems you want to solve or opportunities you want to capture. For example:
- Do you want to connect your global teams into one platform?
- Are you looking to handle seasonal customer spikes without buying extra hardware?
- Do you want to add AI tools for better routing or faster resolutions?
- Do you need to meet regulatory compliance in multiple regions at lower costs?
Talk to everyone involved—IT, frontline agents, managers, compliance officers—to ensure your goals reflect real operational needs. This clarity will shape the rest of your migration decisions.
2. Audit Your Current Systems and Processes
Perform a thorough review of your existing contact center setup. Look at:
- Hardware and software that are outdated or no longer needed.
- Workflows where agents spend too much time switching tools or gathering customer information.
- Data quality—clean up or reformat customer records and interaction histories before migration.
3. Select a Cloud Contact Center Provider with Proven Expertise
Not all cloud providers offer the same support for migration. Choose one with a clear, scalable approach designed for complex moves. Key things to check:
- Do they have a step-by-step implementation plan covering risk management?
- Can they show real enterprise case studies or references proving successful migrations?
- Will their solution seamlessly integrate with your existing tools, such as CRMs (customer relationship management software) and workforce management?
4. Develop a Phased Migration Plan
Avoid moving everything at once. Instead, break the migration into smaller, manageable parts. For example:
- Start with migrating voice calls in one region or department.
- Then add other channels like chat, email, and social media across global teams.
- Finally, introduce AI-powered tools and advanced analytics.
5. Prepare and Migrate Your Data Carefully
Data migration is critical and complex. Classify your data into:
- Operational data, like customer profiles and call histories.
- Analytics data, such as past performance reports.
- Compliance-sensitive data, which might be subject to laws about storage and transfer.
6. Train Your Team Early and Thoroughly
The new system is only as effective as the people who use it. Start training agents and supervisors before migration completes. Focus on:
- How the cloud system improves their workflow by giving them full customer histories in one place.
- How supervisors can use real-time reports to manage the team better.
- Specialized training for agents in regulated industries like finance or healthcare.
7. Test the System Under Realistic Conditions
Before making the full switch, run tests that simulate everyday challenges:
- High call volume during peak seasons.
- Multichannel customer contacts—voice, chat, social media—are handled simultaneously.
- Recovery procedures after network or server failures.
Include input from IT, operations, compliance, and customer service teams to catch problems early.
8. Launch Gradually with Strong Support in Place
Begin with a soft launch: move a small group of agents or one site to the cloud first. Monitor how the system performs and gather feedback. Quickly address any issues before expanding to other teams or locations.
Set up a solid support structure with your provider and internal IT ready to act fast. Define escalation steps clearly to keep disruptions minimal during the switch.
Features of a Modern Cloud Contact Center
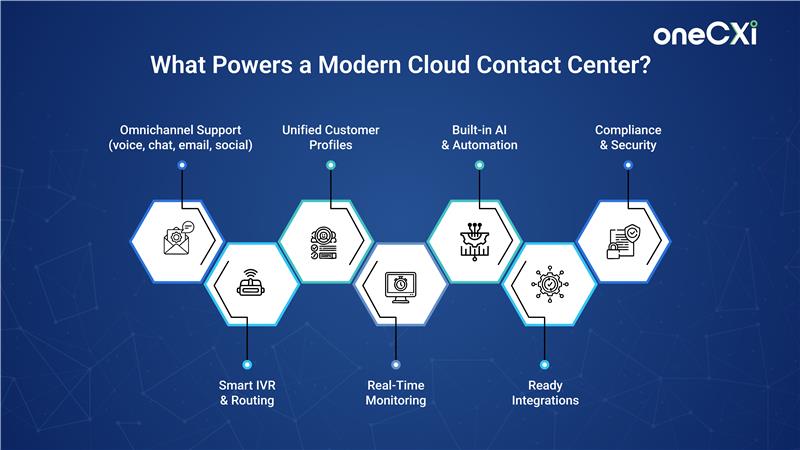
If you’re looking to handle customer interactions efficiently, a modern cloud contact center gives your team the tools to manage high volumes without losing track of quality or speed. Here’s what it should offer:
Omnichannel Support
You can interact with your customers across voice, email, chat, social media, and messaging apps — all from one place. No more jumping between tabs or tools. Your agents can respond faster, stay in context, and maintain a consistent experience, no matter where the customer reaches out.
Smart Routing and IVR (Interactive Voice Response)
Calls and chats automatically go to the right agent based on the customer’s need, the agent’s skill, and availability. IVR menus let customers choose the right department or even resolve simple queries themselves without waiting.
Unified Customer Profiles
A cloud contact center combines data from different systems, like your CRM (Customer Relationship Management), billing software, or helpdesk, into one complete view. Your agents get full context: purchase history, past issues, preferences, and more.
Real-Time Monitoring and Historical Reports
Supervisors can monitor calls and messages live, see how agents are doing, and make quick adjustments. You can also pull detailed reports to analyze trends, agent performance, and customer behavior over time.
Built-in Apps and Integrations
Modern platforms come ready to connect with your CRM, email tools, payment systems, or marketing software. You don’t need to stitch together separate tools.
Security and Compliance
Cloud contact centers apply strong security measures — like data encryption, access controls, regular updates, and backups — to protect customer data and meet legal standards such as PCI (for payments) or HIPAA (for healthcare).
Business Benefits of Cloud Contact Centers
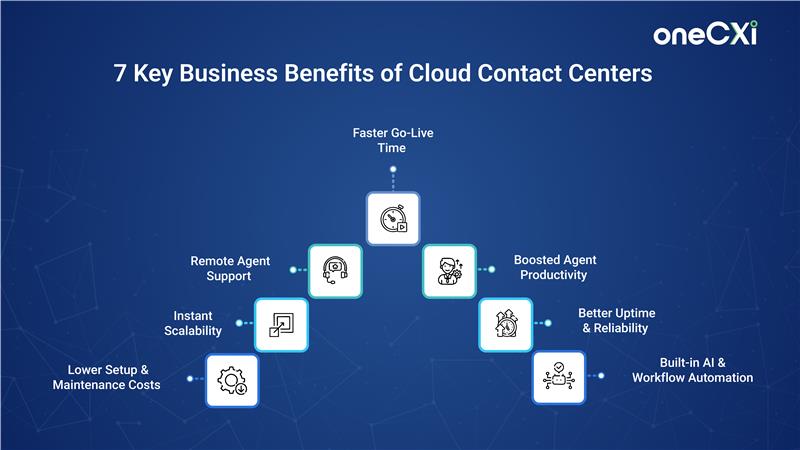
Switching to a cloud contact center is more than just moving to a new tool. It can change how your customer support runs with real, measurable impact. Here’s how:
1. Lower Costs (Setup and Ongoing)
You don’t need to buy servers, hardware, or pay for physical space. The cloud provider handles updates, maintenance, and security. You pay only for what you use.
What it means for you: You save on infrastructure, reduce IT overhead, and can run leaner operations without sacrificing quality.
2. Easy Scalability
Need to add 50 agents during a busy season? Or scale down after a rush? You can do it instantly through the cloud platform — no installation, no logistics.
What it means for you: You only pay for the resources you need, when you need them. No long-term commitments or wasted capacity.
3. Remote-Friendly
Agents and supervisors can work from anywhere with an internet connection. It supports flexible work models and access to a wider talent pool.
What it means for you: You’re not limited by geography. It also improves business continuity — if your office is down, your contact center still runs.
4. Fast Setup
You can go live in days, not months. There’s no need for complex hardware or software installations. Settings, routing rules, dashboards — everything is configured through a web interface.
What it means for you: Faster go-to-market for support teams and quicker ROI.
5. Better Agent Productivity
Agents get everything in one place — no switching tabs or digging through spreadsheets. Features like click-to-call, knowledge base access, and smart suggestions help them respond faster and better.
What it means for you: Happier agents, fewer mistakes, and faster resolutions.
CTA: https://ozonetel.com/webinars/optimize-productivity-effort-service-by-transforming-the-agent-experience/
6. Reliable Uptime
Most providers run their systems in multiple secure locations. Even if one server goes down, another picks up the load.
What it means for you: Less downtime and better customer service continuity during outages or spikes.
7. Built-In AI and Automation
AI tools can handle repetitive tasks like FAQs or routing, while your human agents focus on complex problems. Natural Language Processing (NLP) helps systems better understand customer intent.
What it means for you: More efficient operations and better use of human talent.


What is a Cloud Contact Center? A Complete Guide
Prashanth Kancherla
Jun 16, 2025 | 14 mins read
How Does a Cloud Contact Center Work?
A cloud contact center runs on remote servers managed by your software provider. You access the entire system through a secure internet connection—no on-site hardware or phone systems needed.
Here’s how it typically works:
- Infrastructure and Access: Your provider hosts everything in the cloud. You just need internet-connected devices (computers, headsets, phones). Agents log into the software from anywhere and start taking calls or messages immediately.
- Call and Message Routing: The software automatically routes each customer interaction to the right agent based on rules you set. For example, if someone calls for technical support, the system can skip sales agents and connect them directly to the support team.
- IVR for Self-Service: IVR software helps customers get quick answers through a menu without waiting for an agent. For instance, a caller can press “1” to check their account balance or “2” to speak to billing, before even talking to a human.
- CRM and Context Sync: The system links to your CRM so agents can see a customer’s history, recent purchases, or past issues as soon as they pick up the call. This saves time and helps deliver faster, more personalized support.
- Multi-Channel Conversations: The platform keeps voice, email, chat, and social media conversations in one place. This means if a customer first sends a message on Instagram and later calls your support line, the agent will have full context.
- Monitoring and Analytics: Supervisors can monitor live calls, track performance, and review customer sentiment. You get detailed reports on things like call wait times, agent productivity, and common issues. This helps you identify where things are working and where they aren’t.
- Scalability and Flexibility: Because the system runs in the cloud, you can quickly adjust capacity. Need to add 20 agents during the holidays? You can do that without upgrading any hardware. Want to launch a new support channel like WhatsApp? Most cloud platforms make this easy to switch on.
How to Migrate from On-Premise to Cloud Contact Center
Here’s a detailed, step-by-step guide to help you migrate your contact center without losing operational control or customer satisfaction.
1. Understand Your Goals Clearly
Start by defining why you want to move to the cloud. The reasons should go beyond vague ideas like “improve service.” Think specifically about what problems you want to solve or opportunities you want to capture. For example:
- Do you want to connect your global teams into one platform?
- Are you looking to handle seasonal customer spikes without buying extra hardware?
- Do you want to add AI tools for better routing or faster resolutions?
- Do you need to meet regulatory compliance in multiple regions at lower costs?
Talk to everyone involved—IT, frontline agents, managers, compliance officers—to ensure your goals reflect real operational needs. This clarity will shape the rest of your migration decisions.
2. Audit Your Current Systems and Processes
Perform a thorough review of your existing contact center setup. Look at:
- Hardware and software that are outdated or no longer needed.
- Workflows where agents spend too much time switching tools or gathering customer information.
- Data quality—clean up or reformat customer records and interaction histories before migration.
3. Select a Cloud Contact Center Provider with Proven Expertise
Not all cloud providers offer the same support for migration. Choose one with a clear, scalable approach designed for complex moves. Key things to check:
- Do they have a step-by-step implementation plan covering risk management?
- Can they show real enterprise case studies or references proving successful migrations?
- Will their solution seamlessly integrate with your existing tools, such as CRMs (customer relationship management software) and workforce management?
4. Develop a Phased Migration Plan
Avoid moving everything at once. Instead, break the migration into smaller, manageable parts. For example:
- Start with migrating voice calls in one region or department.
- Then add other channels like chat, email, and social media across global teams.
- Finally, introduce AI-powered tools and advanced analytics.
5. Prepare and Migrate Your Data Carefully
Data migration is critical and complex. Classify your data into:
- Operational data, like customer profiles and call histories.
- Analytics data, such as past performance reports.
- Compliance-sensitive data, which might be subject to laws about storage and transfer.
6. Train Your Team Early and Thoroughly
The new system is only as effective as the people who use it. Start training agents and supervisors before migration completes. Focus on:
- How the cloud system improves their workflow by giving them full customer histories in one place.
- How supervisors can use real-time reports to manage the team better.
- Specialized training for agents in regulated industries like finance or healthcare.
7. Test the System Under Realistic Conditions
Before making the full switch, run tests that simulate everyday challenges:
- High call volume during peak seasons.
- Multichannel customer contacts—voice, chat, social media—are handled simultaneously.
- Recovery procedures after network or server failures.
Include input from IT, operations, compliance, and customer service teams to catch problems early.
8. Launch Gradually with Strong Support in Place
Begin with a soft launch: move a small group of agents or one site to the cloud first. Monitor how the system performs and gather feedback. Quickly address any issues before expanding to other teams or locations.
Set up a solid support structure with your provider and internal IT ready to act fast. Define escalation steps clearly to keep disruptions minimal during the switch.
Features of a Modern Cloud Contact Center
If you’re looking to handle customer interactions efficiently, a modern cloud contact center gives your team the tools to manage high volumes without losing track of quality or speed. Here’s what it should offer:
Omnichannel Support
You can interact with your customers across voice, email, chat, social media, and messaging apps — all from one place. No more jumping between tabs or tools. Your agents can respond faster, stay in context, and maintain a consistent experience, no matter where the customer reaches out.
Smart Routing and IVR (Interactive Voice Response)
Calls and chats automatically go to the right agent based on the customer’s need, the agent’s skill, and availability. IVR menus let customers choose the right department or even resolve simple queries themselves without waiting.
Unified Customer Profiles
A cloud contact center combines data from different systems, like your CRM (Customer Relationship Management), billing software, or helpdesk, into one complete view. Your agents get full context: purchase history, past issues, preferences, and more.
Real-Time Monitoring and Historical Reports
Supervisors can monitor calls and messages live, see how agents are doing, and make quick adjustments. You can also pull detailed reports to analyze trends, agent performance, and customer behavior over time.
Built-in Apps and Integrations
Modern platforms come ready to connect with your CRM, email tools, payment systems, or marketing software. You don’t need to stitch together separate tools.
Security and Compliance
Cloud contact centers apply strong security measures — like data encryption, access controls, regular updates, and backups — to protect customer data and meet legal standards such as PCI (for payments) or HIPAA (for healthcare).
Business Benefits of Cloud Contact Centers
Switching to a cloud contact center is more than just moving to a new tool. It can change how your customer support runs with real, measurable impact. Here’s how:
1. Lower Costs (Setup and Ongoing)
You don’t need to buy servers, hardware, or pay for physical space. The cloud provider handles updates, maintenance, and security. You pay only for what you use.
What it means for you: You save on infrastructure, reduce IT overhead, and can run leaner operations without sacrificing quality.
2. Easy Scalability
Need to add 50 agents during a busy season? Or scale down after a rush? You can do it instantly through the cloud platform — no installation, no logistics.
What it means for you: You only pay for the resources you need, when you need them. No long-term commitments or wasted capacity.
3. Remote-Friendly
Agents and supervisors can work from anywhere with an internet connection. It supports flexible work models and access to a wider talent pool.
What it means for you: You’re not limited by geography. It also improves business continuity — if your office is down, your contact center still runs.
4. Fast Setup
You can go live in days, not months. There’s no need for complex hardware or software installations. Settings, routing rules, dashboards — everything is configured through a web interface.
What it means for you: Faster go-to-market for support teams and quicker ROI.
5. Better Agent Productivity
Agents get everything in one place — no switching tabs or digging through spreadsheets. Features like click-to-call, knowledge base access, and smart suggestions help them respond faster and better.
What it means for you: Happier agents, fewer mistakes, and faster resolutions.
CTA: https://ozonetel.com/webinars/optimize-productivity-effort-service-by-transforming-the-agent-experience/
6. Reliable Uptime
Most providers run their systems in multiple secure locations. Even if one server goes down, another picks up the load.
What it means for you: Less downtime and better customer service continuity during outages or spikes.
7. Built-In AI and Automation
AI tools can handle repetitive tasks like FAQs or routing, while your human agents focus on complex problems. Natural Language Processing (NLP) helps systems better understand customer intent.
What it means for you: More efficient operations and better use of human talent.
Ozonetel Live
Upcoming Webinar

Make it easy for your customers to reach you wherever, whenever, or to help themselves through bots pre-trained to solve retail use cases.
Learn more
Description, experiences: Curating communicative & collaborative customer journeys in Real Estate
Description, experiences: Curating communicative & collaborative customer journeys in Real Estate
Description, experiences: Curating communicative & collaborative customer journeys in Real Estate
Description, experiences: Curating communicative & collaborative customer journeys in Real Estate
Description, experiences: Curating communicative & collaborative customer journeys in Real Estate
Description, experiences: Curating communicative & collaborative customer journeys in Real Estate