- Resources
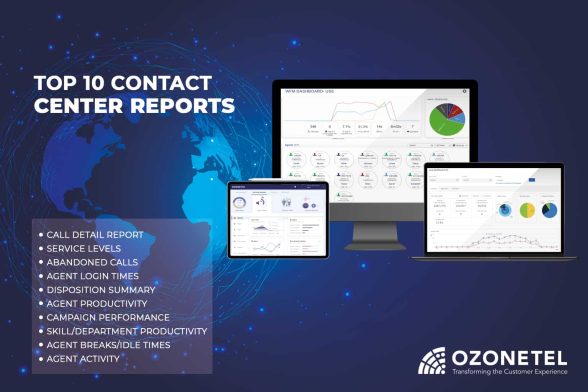
- The Top 10 Contact Center Reports that Supervisors and Managers use most
The Top 10 Contact Center Reports that Supervisors and Managers use most

Anita Raghav
Nov 10, 2023 | 5 mins read
When contact centers initially started moving from legacy systems to the cloud, not all of them understood how powerful data could be. Cloud contact center solutions such as ours generate 70+ reports. Businesses switching from legacy to cloud for other reasons such as to reduce infrastructure costs, or to connect remote offices— found this a big bonus. Happy reviews started pouring in. Managers were able to use reports to monitor and draw insights from every call their support or sales departments received or made.
But I still feel that contact center reports are an underused tool. How can you make best use of this powerful feature? No matter what contact center solution you use, this article should introduce you to many ways of optimally utilizing the reports they generate.
Understanding these reports can help contact center managers achieve better workforce management, productivity, and customer satisfaction levels. They can even give insights to marketing managers on campaign performance, even product performance issues.
Let’s start by understanding the 3 main reasons/ use cases for reports, and then categorize each report under these heads. After that, we will explore the top 10 contact center reports used by managers, supervisors, and team leads across various outbound and inbound contact centers.
Broadly speaking, there are two user groups who use contact center reports:
- Supervisor Groups / Team Leads. This group needs real-time metrics and monitoring to prevent escalations and manage their agent workforce efficiently. They also need historical reports (management reports) to measure and report to their managers.
- Head of Customer Support / Customer Experience / Customer Success. These users need reports for a top-level view of performance metrics (daily /weekly/monthly/quarterly). They also need reports/ metrics which will correlate to other activities done in other departments.
In this article, we will explore:
The three categories for contact center reports
The traditional way of categorizing reports is by user group, that is, agents, team lead, and management reports. But I find that a more practical way to categorize them is by intent, that is, based on what these reports are used for.
Category 1: Reports that measure CX.
Some reports measure use customer service/experience as the key indicator to measure contact center performance. You measure these against industry benchmarks or predefined SLA’s (Service Level Agreements) or your organization guidelines. The key intent behind these metrics is to measure how customers feel about your service.
Category 2: Reports that monitor performance
These are reports which give you metrics about your teams, agents, or various skills. Here, you can define “Skills” as teams or departments. (While one skill can consist of a single team, a single skill can also have multiple teams with each team reporting to a supervisor/team lead. To know more, also read Skill Hunting)
These reports help you in understanding your agents/teams’ adherence to log-in times, SLA, AHT’s(Average Handle times Abandon rates, Productivity, Schedule adherence to rosters, and other productivity metrics.
Category 3: Reports to manage the big picture
The supervisor or admin reports tend to focus on real-time metrics. The aim is to be able to fix problems as they occur. For example, a supervisor’s report helps to catch a slacking agent or to prevent an escalation. Management reports are focussed on the big picture: or how to improve your awesomeness in the long run. Management reports are a net summary of the output. They focus little on the operational details. For example, an SLA report is essential, but you do not require these as real-time reports. A four-hourly or a daily report will suffice. Similarly, agent productivity reports or campaign reports can be synced up with marketing numbers to measure source effectiveness based on conversions or answer rates per campaign.
Here are some examples of metrics used in these 3 report categories with a corresponding explanation of who uses it (admin or supervisor or management) and why:
| REPORTS THAT MEASURE | REPORTS THAT MONITOR | REPORT THAT MANAGE | |
|---|---|---|---|
| Service Level Agreement (SLA) | Agents/Supervisors use this to ensure adherence to SLA’s and accuracy of trend forecasts. | Agents/ Supervisor use these reports to reschedule agent rosters to meet future SLA’s. | Managers use this to know if the contact center is meeting the set standards for customer service. |
| Agent Login Adherence | Agents/ Supervisor use this to ensure Shift Adherence | Agents/ Supervisor use these reports to adjust agent schedules and offer OT’s when some agents do not log in due to emergencies | Managers use this to know if the contact center is meeting the set standards for customer service. |
| Agent Breaks | Agents/ Supervisors use this to ensure adherence to the roster on a daily/weekly/monthly basis. | Agents/ Supervisors use these reports in real-time to adjust rosters and also enforce shift adherence. | Management uses these reports on a monthly basis to review the agent’s performance and discipline. |
| Agent productivity reports | Agents/ Supervisors use these reports to record and review agent performance on a daily/weekly/monthly basis | Agents/ Supervisors use this to push all agents to perform equally and efficiently. | Management uses these reports on a monthly/quarterly basis to review performance review and identify training needs. |
| Customer Feedback Reports | Agents/ Supervisors use these reports to get a view of what customers think of your contact center. | Team leaders use these reports to deal with negative CSAT on an immediate basis. | Management uses these reports to review negative feedback and to use it to change their processes. |
You should be able to categorize any report similarly. That is by understanding the intent behind it, and with an understanding as to who can use the reports in what way. It helps to know which reports should be sent to which user. That is, which reports need to go to supervisors, and which need to go to management.
The Top 10 Contact Center Reports
So what are the top 10 contact center reports that are most commonly used by the contact center, customer success, and customer experience managers and supervisors? Here are the top 10 that our customers swear by.
Report #1: CDR (Call Detail Report)
Why did your customer call back your call center? Why wasn’t their complaint addressed in the first call? And, why did they demand to speak to a manager? What is the cause of these escalations? Was it that the agent was rude? Did they misinform the customer about a policy? Were they incapable of handling the complaint? Did they not have access to the information they needed to help the customer? Knowing what causes an escalation is extremely important. No wonder then that CDR or Call Detail Reports are one of the most used reports.
As the name suggests, the call detail report captures various call details. It can be used to review any escalations or to cross-check any discrepancies in claims by an agent or customer. Quality Assurance teams use a subset of this report to review agents. These reports help to monitor and track down a poor performer, overall poor training, or poor knowledge management systems.
This report isn’t restricted to calls. A CDR is now also known as a Communication Detail Report. It encompasses communications across various channels including chat, email, and social media.
Report #2: SLA report (Service level Agreement Report)
Most contact centers have an SLA for pickup time, also known as, ASA (Average Speed of Answer). Usually, contact centers have an 80-20 rule which means 80% of calls have to be answered in 20 seconds. However, Gemma Caddick, a Forecast Analyst at Severn Trent Water remarks in her blog for call center helper ” ..what has become clear to me in the last 11 years of my resource planning journey is that no one seems to know where 80/20 came from.” The article goes on to cover how one should be focussing on more ambitious SLAs, ensuring that no customer is made to wait. Indeed, some of our clients run customer support centers on our platform that manage 90% of calls being answered within 10 seconds, and that too, by a live agent.
At any rate, when today’s impatient customers contact you via call or chat, it is critical to ensure that you respond fast. No wonder then, that Average Speed of Answer remains one of the most critical and popular reports that managers and supervisors use.
Also read:What is Average speed of answer, and how to reduce it
Report #3: Abandoned Call Rates
According to our latest research, the abandoned call rate stands at an average of 12% across contact centers. These are the percentage of callers who abandon calls while waiting in your call center queue. Abandonment rates can also be tracked for your live chat or messaging queues.
This report is a subset of the SLA report. It is an hourly / daily/weekly/monthly report which allows the management and TL’s to know where they stand in terms of answered rates.
Abandoned call reports can be accessed by supervisors to ensure callbacks to the customers. These callbacks can also be scheduled into a dialer. Abandoned Call reports can also be used with Abandoned Call Alerts. These alerts can be sent directly into a supervisor’s inbox to ensure timely callbacks.
Also read: Call Queue Management to reduce abandoned calls/chats and improve SLA
Report #4: Agent Login Report
Our fourth most popular report is Agent Login Report. This is used for reporting on shift adherence and agents’ attendance management. Most contact centers have compensation linked to shift adherence and this is an important report used daily/weekly by supervisors to measure it.
Report #5: Disposition Summary Report
Your contact center was basically set up for letting customers interact with your business. So naturally, it captures a wealth of information about the problems and issues they face with your business. For example, technical faults with a product you sell, complaints about a rude delivery agent, inquires about when a product will be stocked by your e-commerce site, difficulties with navigating your website—all these reach your contact center. How does the management learn of these customer complaints, suggestions, doubts, and sometimes even compliments?
Agents can also add notes to these dispositions to give further details. Management can view these dispositions via the “Disposition Summary” reports. Disposition summaries can be used to communicate problems to your operations managers and other management. These reports are a gold mine, which, if used properly, provides real value to businesses and helps justify contact centers as more than just cost centers, but as important contributors to business growth.
Also Read:ACW Primer—Expert tips to measure and improve performance
Report #6: Agent Productivity Report
This report is used to measure each individual agent’s performance capabilities and to identify top and bottom performers. An agent productivity report for outbound calls shows their talk time, wrap time, conversion rates. Inbound agent productivity reports show average talk times, wrap times, and first call resolutions or Csat scores. You can map this across various campaigns, both inbound and outbound. It helps to identify your agents’ training needs. For example, inordinately long wrap times may indicate a need for training or modification of disposition codes. Poor FCRs, Csat scores or long talk times also indicate what aspect a poorly performing agent needs to be trained in.
Call Center Supervisors view agent productivity reports to identify high and low performers and then delve into their call recordings for more information. They use call recordings of high performers as training material. And listen to call recordings of low performers to identify weaknesses. Soon managers will use Speech Analytics in addition to agent productivity reports to glean more information about performance.
Also Read:How Speech Analytics can measure & improve performance in your contact center
Report # 7: Campaign Productivity Report
These reports give source wise or published number wise metrics and overall adherence to answered rates/ SLAs/AHTs. These reports are for both inbound and outbound processes.
For outbound processes such a sales calls, the campaign productivity reports can help marketing managers identify whether a campaign success or failure was due to issues in campaign execution, agent training or data (unqualified leads, incorrect numbers).
Similarly, looking at inbound campaign reports helps identify campaign-wise Csat thereby uncovering reasons for repeat customers or brand promoters (or lack of them).
Report # 8: Skill Productivity Reports
These reports allow you to measure a group of agents or skill-wise productivity. Skills are agent groups that you create based on their capabilities or duties. Seeing their performance as a group, helps you identify and easily execute training.
Report # 9: Agent Breaks Report
Our latest report shows that agents spend about 12.9% of their time on breaks. Breaks are important in a stressful job such as customer support or sales. The Agents Break Report helps the Team Leads to monitor and enforce /ensure adherence to rosters. Of course, you may want to speak to agents who are taking more breaks than usual. But, you can also check if an agent isn’t taking enough breaks, and that is leading to a dip in performance.
Also Read:Agent Performance Metrics for 2018-19
Report # 10: Agent Activity Report
When you have large sales teams, workforce management is difficult. Reports can help you. Floor managers, team leads, and supervisors periodically do a deep dive into agent activity. They monitor activity logs—to ensure agents aren’t cheating the system.
At other times supervisors may need to see the hours logged in by agents and sync this with their roster to ensure agents are indeed logging in within their scheduled work hours.
Agent activity report cover when an agent logs in, when they take breaks, and how many calls they answer within that time. It gives you a sequential breakup of when they answer calls, disconnect and follow up, along with average handle times, pickup times, and wrap times.
The amount of data your cloud contact center can generate for your business are vast. Combined with new tools such as artificial intelligence, machine learning, and predictive analysis, their potential is limitless. You can achieve a lot by experimenting. Find what metrics you need to measure, then relentlessly work on improving them. If you reap concrete results like higher productivity or improved satisfaction, you know you are on the right track. If not, change your process. It is important as always to know your priorities and keep your eyes on what matters most to you.
This is where the disposition summaries come in. Agents use disposition codes to summarise calls. It captures:
- Reason for a call.
- The outcome of the call.
- Follow up instructions.