7 Call Center KPIs that most impact customer satisfaction

Anita Raghav

Oct 19, 2023 | 6 mins read

It’s good business sense to periodically analyze key performance indicators (KPIs) or metrics to better streamline ops and processes to optimize for CSAT and ROI. The good (rather great) news is that in the call center world, KPIs are highly data driven, taking the guess work out of the mix!

What is a call center KPI?

KPI’s or key performance indicators are metrics that help you determine whether your business, team, or individual team members are meeting goals in a manner that is aligned to overall business growth. Call center KPIs, in turn, are metrics that measure how effectively a call center is meeting business objectives such as customer retention, customer satisfaction, and growth in an efficient manner.

Call center KPIs therefore fall into two categories, those that affect customer satisfaction, and those that measure operational efficiency or agent productivity.

Which call center KPIs most affect customer satisfaction?

According to a study published in the “European Journal of Social Sciences” in 2008, customer satisfaction is most influenced by the following KPIs: the percentage of calls blocked, average speed of answer, and service level. 

These KPIs typically affect how fast a customer can connect with a call center representative. Naturally if a customer has to wait for a long time to express their complaint, they will be frustrated, while a quick response is more likely to de-escalate a situation, enable a prompt resolution, and in turn enable higher satisfaction. 

Other KPIs that can be used to determine customer satisfaction are first call resolution, and CSAT scores. However, CSAT scores may reflect other customer interactions with a brand and is not restricted to their experience with your call center alone.

Which call center KPIs measure productivity 

KPIs that measure a call center’s productivity are critical for enabling high operational efficiency and lower cost per customer. Call center metrics that measure this include cost per customer, average handle times, idle times, and agent utilization rates.

Key performance metrics your call center can measure

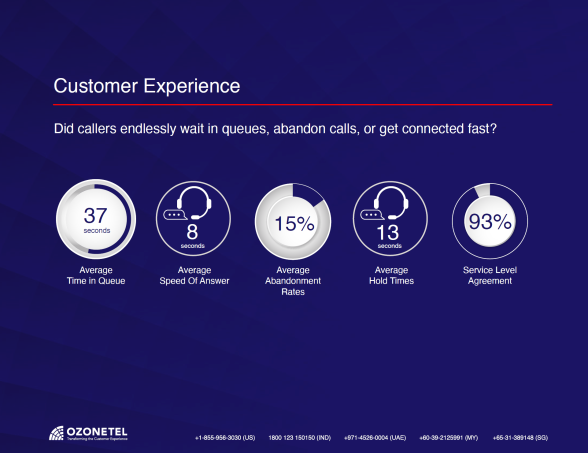
Did customers wait indefinitely in queues, get frustrated and abandon calls, or were they attended to speedily? Here are 8 metrics that you can determine from your call center software reports A robust call center software solution will provide hard numbers on each of the following KPIs to help businesses maximize throughput.  

Average Time in Queue 

This is the amount of time customers wait in order to get connected to an agent when they call a business. This directly impacts customer satisfaction. Increased time in queue demonstrates an inadequacy of agent availability. Optimal scheduling by the hour of day or week of the day, etc. helps meet high call volumes more efficiently.

INDUSTRY STANDARD FOR AVERAGE TIME IN QUEUE: As per our last study, in 2020, the Average Time in Queue was 37 seconds across various call centers. 

Average Speed of Answer

It’s the time agents take to answer inbound calls; how fast agents answer calls.

INDUSTRY STANDARD FOR AVERAGE TIME IN QUEUE: As per our last study, in 2020, the Average Speed of Answer was 8 seconds across various call centers. 

Average Abandonment Rate

It is the number of calls that go unanswered as callers disconnect while in queue. It’s important to track because unanswered or abandoned calls = missed opportunity to connect with a customer or prospect. Perhaps a lucrative sales lead was missed, or a complaint went unaddressed, or some valuable feedback fell through the cracks.

INDUSTRY STANDARD FOR AVERAGE TIME IN QUEUE: As per our last study, in 2020, the Average Abandonment rate was 37 seconds across various call centers. 

Average Hold Time

It’s the amount of time a caller waits when an agent puts him/her on hold to retrieve information, speak to a supervisor, or transfer the caller. This KPI effects both customer experience and can increase or decrease the average handle time, thereby affecting the cost per call and overall call center productivity.

INDUSTRY STANDARD FOR AVERAGE TIME IN QUEUE: As per our last study, in 2020, the Average Hold Time was 13 seconds across various call centers. 

Average Talk Time

This metric shows how long an agent spends talking to a caller on average. Average talk times are used to calculate average handle times and to measure the overall contact center efficiency. Good skill-based training and the use of CRM / CTI pop-up windows can help improve this KPI. 

INDUSTRY STANDARD FOR AVERAGE TIME IN QUEUE: As per our last study, in 2020, the Average Talk Time was 4 minutes across various call centers. 

After Call Work (ACW)

AWC or post-call processing is the work a call center agent puts in after speaking to a customer. Tasks such as updating customer information, adding call disposition and notes, call logging, or email / message follow up. Until ACW is complete, the agent’s status remains busy or unavailable. ACW affects agent productivity and contact center efficiency.

INDUSTRY STANDARD FOR AVERAGE TIME IN QUEUE: As per our last study, in 2020, the Average Time spent of ACW was 45 seconds across various call centers. 

Calls Dialed Per Agent

Calls dialed per agent helps companies optimally plan outbound campaigns. Agents may dial outbound calls manually or by using click to call from their CRM. Auto dialers may also be used to automate calling and directly connect agents to prospects. For ideal optimization outcomes use a predictive dialer.

Pick-up / Answer rate (Outbound calls)

This KPI reveals how many calls actually connected to a contact. Average pickup / answer rates inform the efficacy of an outbound campaign in terms of timing and data quality. In outbound calling, a lot of calls dial to busy lines, or go unanswered.

INDUSTRY STANDARD FOR AVERAGE TIME IN QUEUE: As per our last study, in 2020, the Average Answer Rate was 38% across various call centers. 

Average Time in Queue 

Improve average time in queue to positively impact CSAT and company bottom line by:

  • Accurately projecting call volumes so staffing can be increased or paired down accordingly. 
  • Training agents to resolve problems faster and wrap after call work (ACW) rapidly. 
  • Setting call queue limits for each skill to route calls to. When queues exceed those limits, auto route them to other skills or agents. 
  • Diverting simple transactions to a self-service IVR. Transactions that are best suited to self-service IVR include location confirmation, booking confirmation, checking ticket/delivery status, and cancellations. 
  • Reducing call queues by letting callers opt for voicemail and call-backs. Deliver these voicemails to a priority inbox. Use a power dialer to automate callbacks. 
  • Using Dynamic Queue Reprioritization to ensure that high value customers are never made to wait in queue. Use CTI integrations to recognize these callers and push them to the top of the call queue.

Average Speed of Answer

 Improve average answering speed, caller wait time, and finally CSAT by:

  • Assessing your telephony solution. Landlines or mobile phones take up to 6 seconds for call ringing. VOIP and softphones instantly hit the call to agents.
  • Improving agent training to wrap and answer calls faster.
  • Using auto answer to connect callers to agents within a second.

Average Abandonment Rate

Overall, reduce abandonment rates and customer attrition by:

  • Using skill-based routing to distribute calls optimally amongst agents. 
  • Defining Call Queues for each skill. Create fallbacks such as routing calls to other skills or a self-service IVR during high call volumes.
  • Ensuring adequate staffing to keep call queues short. 
  • Offering voicemail and call-backs to callers when queue time exceeds a defined limit.

Average Hold Time

Address high average hold times by improving training or poor transfer technology:

  • Route callers to the right agent skill by improving the IVR options. 
  • Cross-train agents to handle multiple call types to minimize transfers. 
  • Improve agent problem diagnosis and resolution skills. 
  • Ensure that agents have easy UI to transfer calls when needed.

After Call Work (ACW)

Lower ACW to lower call queues, and enhance customer experience by:

  • Using Call Disposition codes instead of requiring agents to add notes. 
  • Limiting Wrap Codes to five master reasons and five sub reasons; and restrict Wrap Codes to a single level. 
  • Integrating with CRM to automate call logging and schedule follow-ups in a unified window. 
  • Improving agent training. Experienced agents can wrap calls 20% faster than novices.

Pick-up / Answer rate (Outbound calls)

This can be reduced by changing dialers, data, or call times. 

  • Reduce customer fatigue by utilizing alternate communication channels. Data shows that pickup rates have reduced particularly in ecommerce and healthcare. An alternate communication channel (e.g. SMS or WhatsApp) may help improve pick-up rates in these sectors. 
  • Do an industry-wise analysis to see trends in customer fatigue or improved answer rates to pick the right communication channel to connect with customers. 
  • Switch from predictive to Power Dialers or change your pacing ratio to reduce drop rates and increase answer rates. 
  • Low answer rates also indicate poor data quality. Improve data quality or contact leads via other channels, before scheduling a call. Reschedule calls for separate times of the day, and days of the week, to see which day and time offers the best answer rates.

Conclusion

Call Center metrics and KPIs vary by business type and country. Benchmarking call center performance allows businesses to optimally meet goals and further improve their CX, agent performance / wellbeing, and ROI now and in the future.

Ready to take control of your call transfer
experience for better CX outcomes?

Anita Raghav