2021-22

A study across millions of customers service & sales calls in various vertical industries
Every December we turn introspective. As leading contact center solution providers, we study key performance data across diverse call centers including average talk time, queue times, speed of answer,wrap times, outbound call pickup rates, and more.
This year we took a sample set of 24 million calls made on our platform by 61914 active agents. The contact centers belong to erprises, start-ups, small and mid-sized businesses across education, real estate, travel, finance, eCommerce, food & restaurants, pharma, and banking. It includes a study of customer service as well as telemarketing, inbound sales, and outbound sales calls.
Lorem ipsum dolor sit amet, consectetur adipiscing elit. Ut elit tellus, luctus nec ullamcorper mattis, pulvinar dapibus leo.
Key Performance Metrics
Inbound Calls
Inbound calls are primarily for customer support and order processing some sectors, these inbound calls include inbound sales calls. This study aggregated key customer experience and agent performance metrics across these calls including Time in Queue, Abandonment Rates, Speed of Answer, Hold Times, Talk Times, and After Call Work.
Outbound Calls
Outbound calls include sales calls as well as outbound customer service and confirmations calls. Here the number of outbound calls dialed and answered are a key indicator of performance. Therefore, we studied both the calls dialed per agent as well as average Pickup or Answer Rates.
Inbound: Customer Experience Metrics
Average Time in Queue (AWT)
Average Agent Speed Of Answer
Average Abandonment Rates
Average Hold Times
Service Level Agreement
Average Time In Queue?
Average Time in Queue reveals how long callers wait to get
connected to someone when they phone a business.
Why measure average time in queue?
Being made to wait in queues can drastically reduce customer satisfaction, increase abandonment rates, and consequently increase customer churn.
- High average queue times indicates insufficient agent availability.
- Low average queue times indicates adequate agent availability.
How to improve average time in Queue?
To improve your queue times, you need to investigate when and why your queue times are going high. Hourly and weekly call queue reports can help identify if call volumes are higher on a particular day or time. Once you have done this, consider using the following measures:
- Accurately project call volumes based on your historical reports and increase staffing accordingly.
- Train agents to resolve problems faster and wrap ACW more quickly.
- Set call queue limits for each skill you route your calls to. When queues exceed those limits, autoroute them to other skills or agents.
- Divert simple transactions to a self-service IVR. Transactions that are best suited to self-service IVR include location confirmation, booking confirmation, checking ticket/delivery status, and cancellations.
- Reduce call queues by letting callers opt for voicemail and call-backs. Deliver these voicemails to a priority inbox. Use a power dialer to automate callbacks.
- Use Dynamic Queue Reprioritisation to ensure that high-value customers are never made to wait in queue. Use CTI integrations to recognize these callers and push them to the top of the call queue.
What is the Average Agent Speed Of Answer?
Why measure Average Agent Speed of Answer?
The average speed of answer indicates how fast your agents answer calls. This KPI affects caller waiting times and consequently affects customer satisfaction.
How to improve The Average Speed of Answer?
The type of telephony you use could affect the Average Speed of Answer.
- Landlines or mobile telephones take up to 6 seconds for call ringing.
- VOIP and softphones instantly hit the call to agents.
To improve agent speed of answer, the following steps should be taken:
- Improve agent training so agents wrap calls and answer faster.
- Use an auto-answer so that calls connect to agents within 1 second.
What is Abandonment Rate?
Why Measure Abandonment Rates?
Abandonment rates indicate the number of calls that go unanswered in your call center. This represents a missed opportunity to speak to a customer or prospect who has called your business for a sales inquiry, complaint, or to give valuable feedback.
How can we reduce Abandonment Rates?
Generally, our clients have stringent service level agreements, for which we need to maintain high answer rates and consequently low abandonment rates.
- Use skill-based routing to distribute calls better amongst your agents.
- Define Call Queues for each skill.
- Ensure adequate staffing to keep call queues short.
- Create fallbacks such as routing calls to other skills or a self-service IVR during high call volumes.
- Offer voicemail and call-backs to callers when the queue time exceeds a defined limit.
What is AHT - Average Hold Time?
Why measure Average Hold Times?
Average hold times affect both customer experience and can increase or decrease the Average Handle Time, therefore, affecting cost per call and overall call center productivity.
How can we reduce AHT?
High average hold times indicate lack of training or poor transfer technology.
- Route callers to the right agent skill by improving the IVR options.
- Cross-train agents to handle multiple call types to minimize transfers.
- Improve agents’ problem diagnosis and resolution skills.
- Ensure your agents have an easy interface to transfer calls when required.
What is Service Level?
Service level indicates how many calls are answered within twenty seconds. Aggregated across Industries, most of our clients maintained an average service level of 93%. This means most clients answered 93% of calls in twenty seconds or less.
These levels vary based on business KPIs. For instance, this is how service levels varied across four sectors:
● Financial Services: 95% calls answered in under 20 seconds.
● BPO: 99.9% calls answered in under 20 seconds.
● eCommerce: 98% calls answered in under 20 seconds
● Pharma: 80% calls answered in under 20 seconds.
How do we maintain high service levels?
To maintain high service levels we need to maintain high answer rates and consequently low abandonment rates. You can achieve this by following all the measures we outlined earlier including:
● Effective Call Routing and call distribution
● Accurate Staff Forecasting
● Adequate Staffing
● Effective staff training
Outbound Call Center Metrics

Calls Dialed Per agent

Average Answer Rates
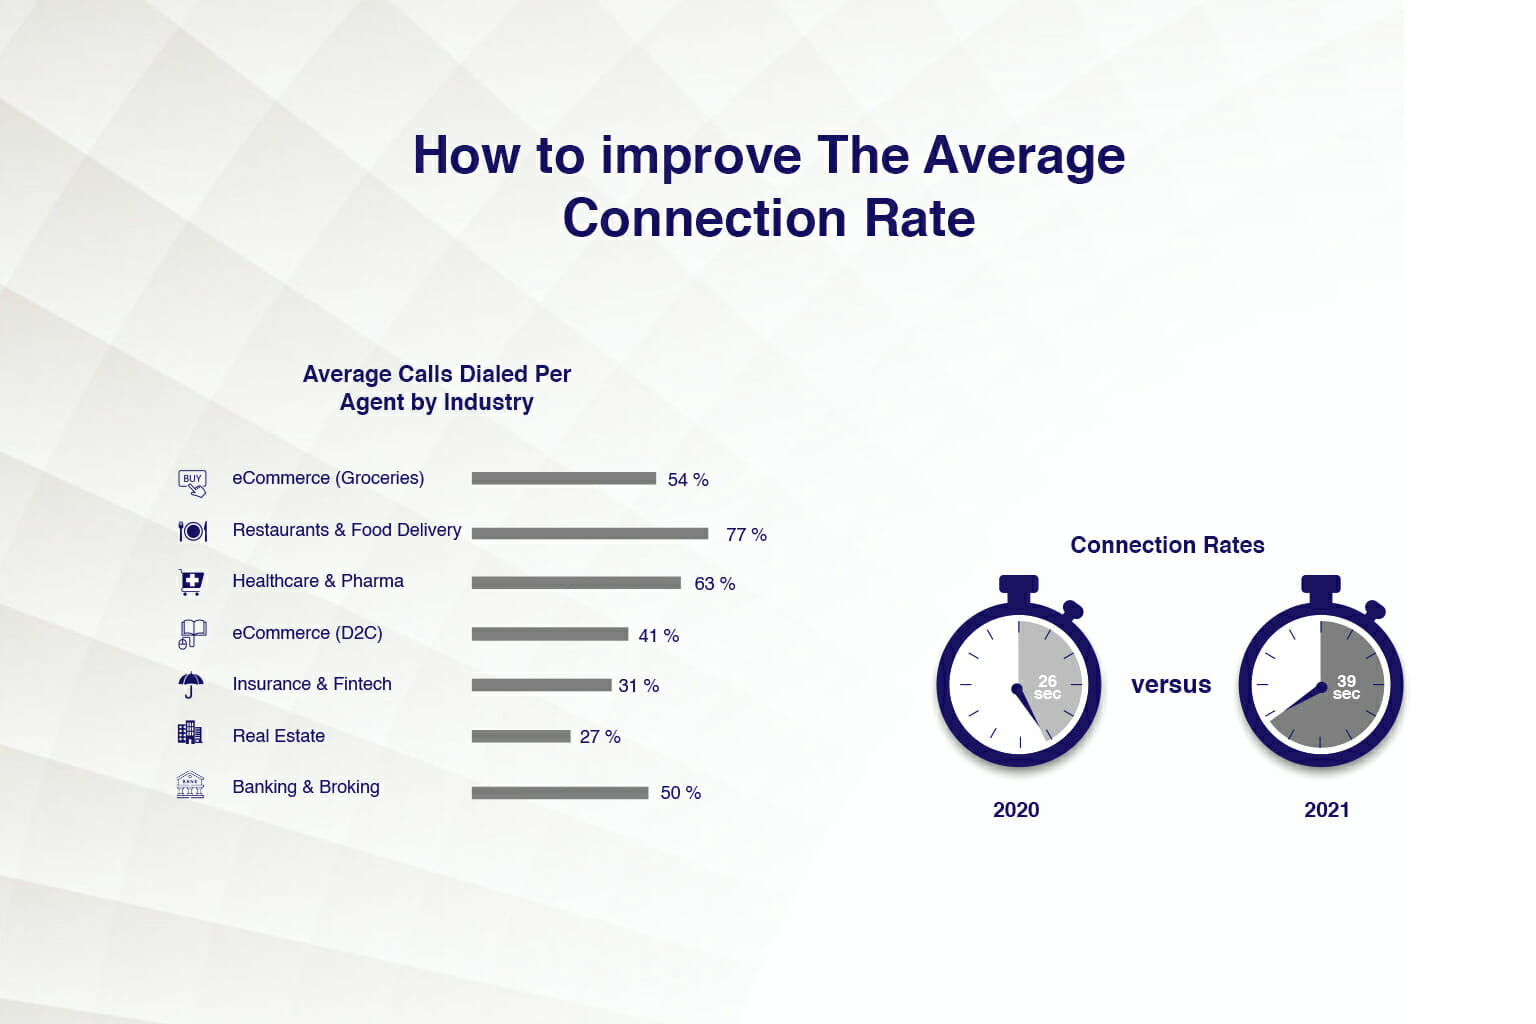
What is Connection Rate or pick-up rate?
Why measure Connection Rate ?
This metric lets you know the effectiveness of your outbound campaigns.
Why measure Connection Rate?
How to improve The Average
Connection Rate?
To improve how many contacts pick up your calls, you need to ensure you choose the right dialer, the right timing, and the right caller id. Reschedule calls for separate times of the day, and days of the week, to see which day and time give you the best answer rates. Consider using virtual number masking to display local phone numbers within your caller id to improve answer rates.
Agent Efficiency Metrics
Average Talk Times
Average After Call Work
Average agent Speed of Answer
Average Hold Times
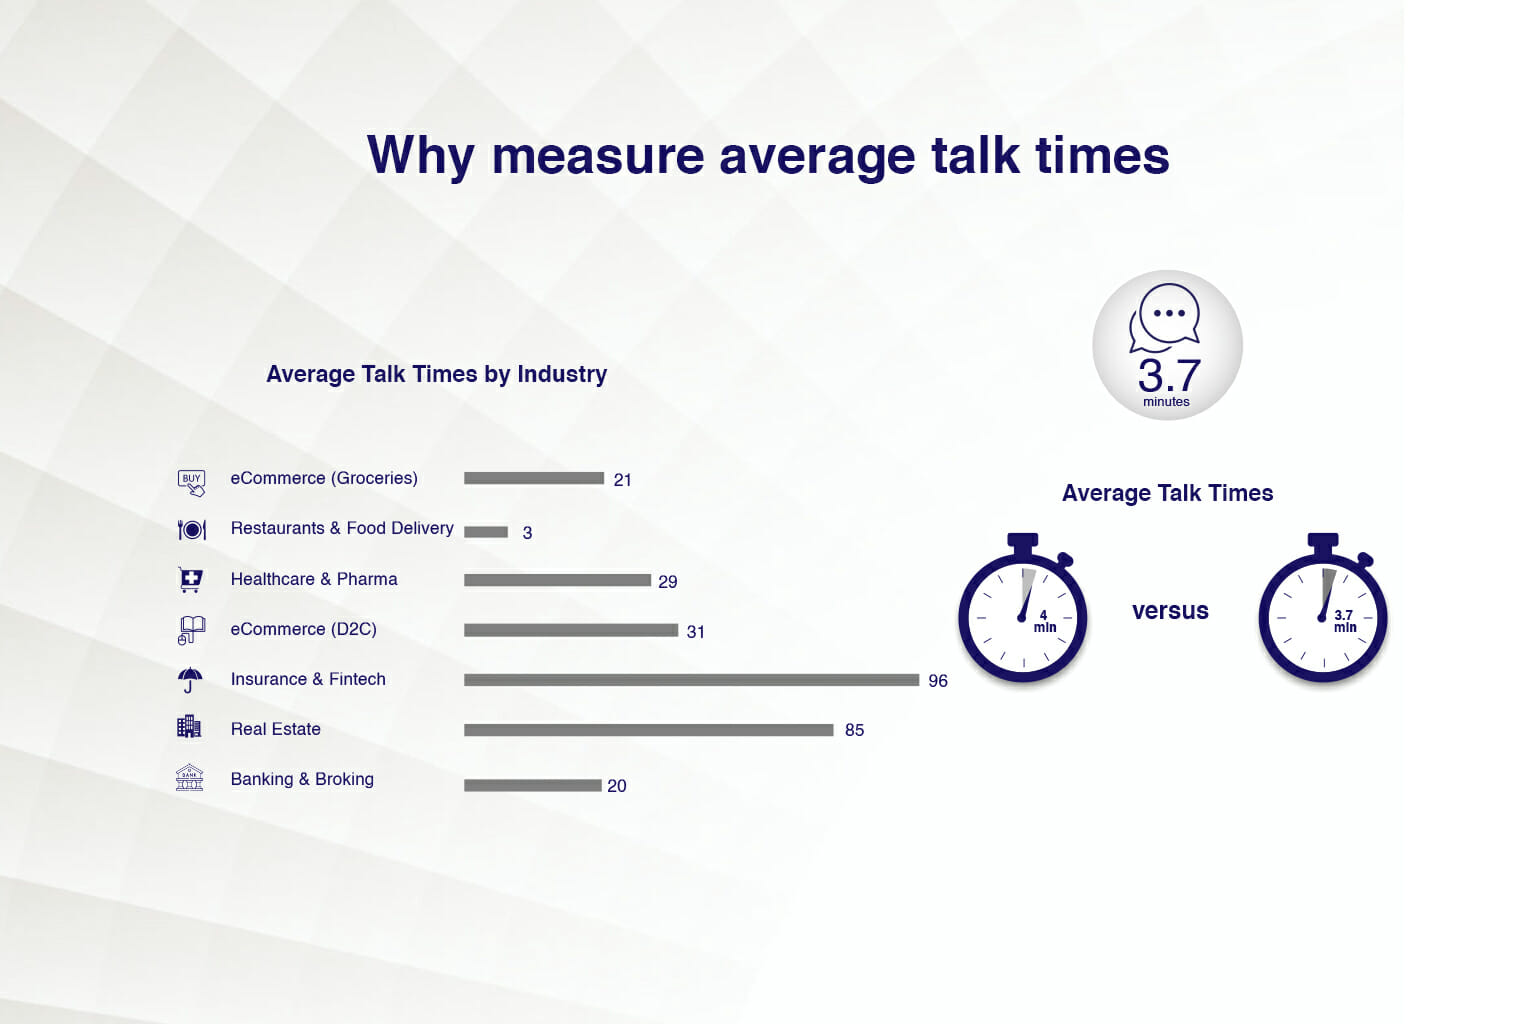
What is Average Talk Time?
Average Talk Times tell you how long an agent spends talking to a caller on average.
Why measure average talk times?
Average talk times measure a contact center’s efficiency.
These rates help you to determine your call center staffing requirements and your cost per call.
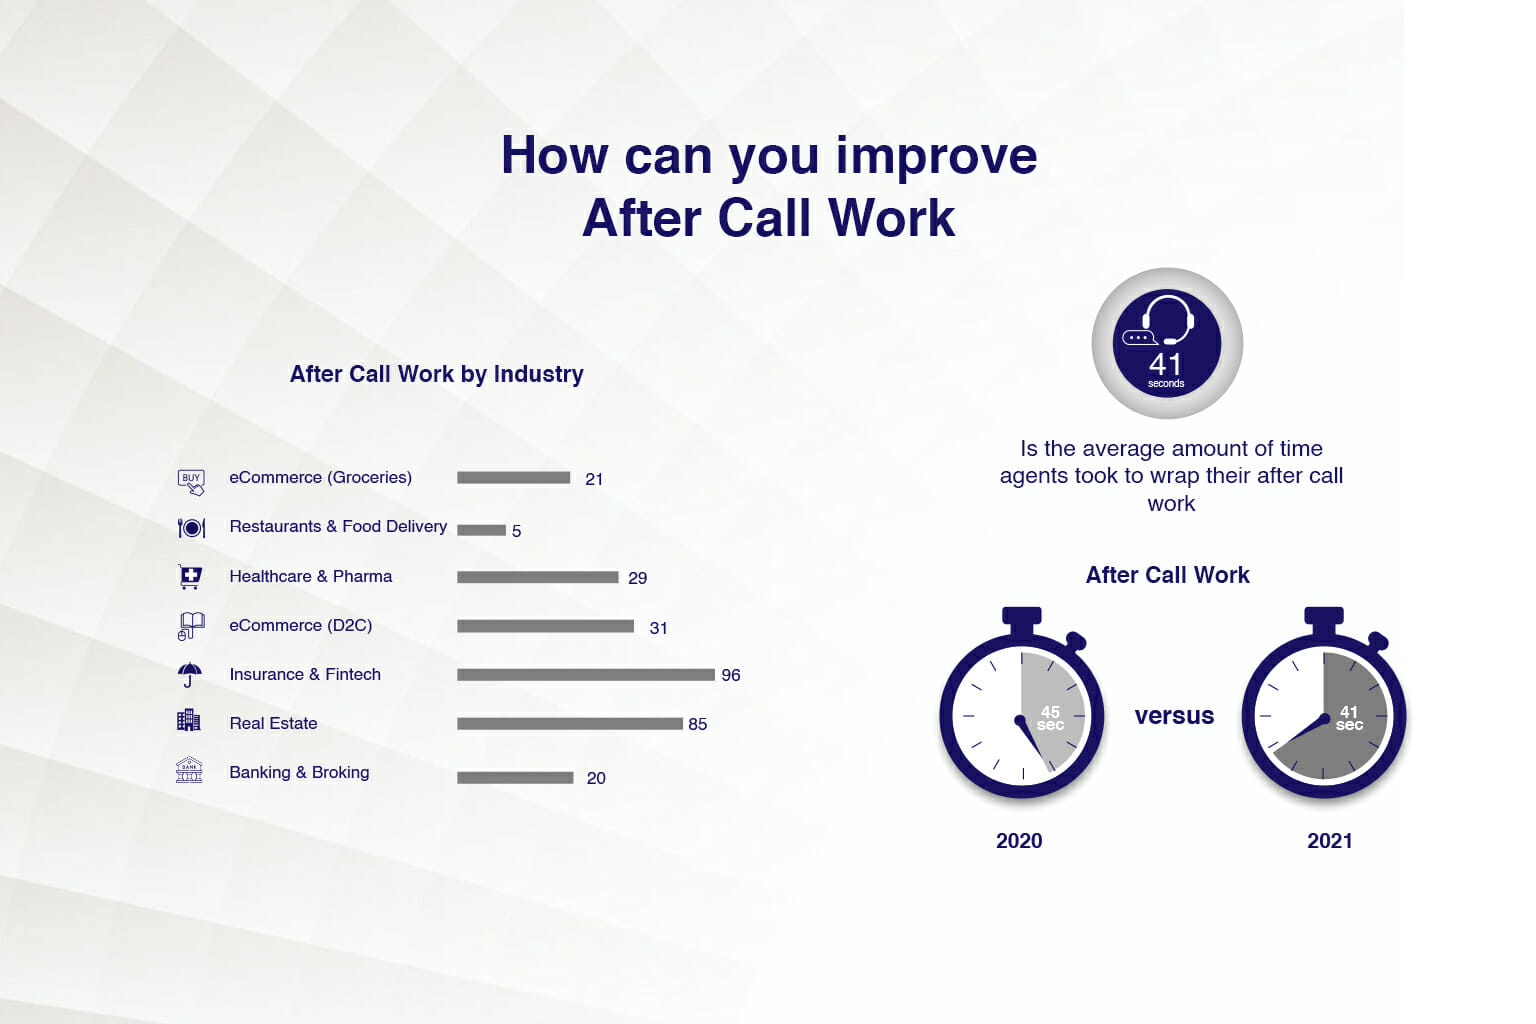
What is After Call Work?
Why Measure ACW/Wrap Time?
How can you improve ACW?
You can reduce ACW in the following ways:
- Use Call Disposition codes instead of requiring agents to add notes.
- Limit Wrap Codes to five master reasons and five sub reasons. And restrict Wrap Codes to a single level.
- Integrate with CRM to automate call logging and schedule follow- ups in a unified window.
- Train Agents. Experienced agents can wrap calls 20% faster than novices.