Infographic: How did Contact Centers Perform in 2018?
Infographic: How did Contact Centers Perform in 2018?
Anita Raghav
Nov 9, 2023 | 5mins read
A visual synopsis of contact center performance in the year that was.
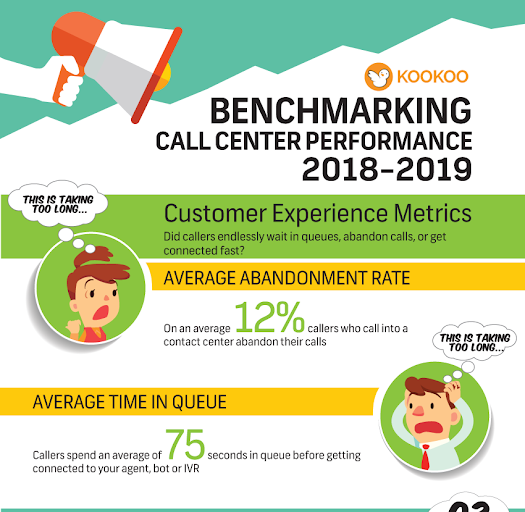
Did you know that 12% callers abandon their calls in the queue? This was in spite of an average queue time of 75 seconds. In the meanwhile, in outbound call centers only 44% of the calls dialed are actually answered. For those who haven’t found the time to download our Contact Center Performance Report 2018-19, here is a quick visual overview.
Download a detailed report of the contact center metrics here.
Average time in queue or how long callers have waited in the queue to listen get connected.
How many callers gave up and disconnected while still in the queue, or average abandonment rate.
How many minutes agents spent per call or handle times.
Average wrap times, or how long agents took to complete their ACW.
How many breaks agents take on an average.
Average Answer rates in outbound call centers, or how many calls were answered of all the calls dialed in outbound contact centers.
Ready to take control of your call transfer experience for better CX outcomes?